

Fact Sheet FS1346
The Web Soil Survey (WSS) is a web-based soil survey developed and operated by the USDA—NRCS (Natural Resources Conservation Services). It provides information about the inherent characteristics of the native soil types (or series) at a specific location. The web-based platform offers easy access to the largest natural resource information system in the world, in addition to mobile-based Apps available for Android and iOS. The WSS includes soils maps and related data on more than 95% of the counties in the United States, making it a comprehensive source of information for growers.
This fact sheet illustrates the importance of using WSS before making major decisions such as purchasing a parcel of land or planting high-value crops that are sensitive to specific soil types. It offers step-by-step instructions beginning with locating an area of interest and subsequent steps on how to obtain specific information on soil characteristics.
Why Use the Web Soil Survey?
New Jersey alone has 85 unique soil series and each one has different characteristics that make it more or less suited for various agricultural practices. A soils map is further classified into soil map units based on soil textural classes, slope of the landscape, inherent soil pH, drainage characteristics, and depth of topsoil. Many farms throughout the state have multiple soil map units occurring within the same field. The mapping features provided by the WSS can help to accurately identify where each of these different soil map units occur on the property. The WSS provides a tool to 'see' the field in a different geometry (with the 3rd dimension of depth, not just topography), based on these properties.
Perennial crops such as tree fruit, wine grapes, and blueberries grow best in specific soil types, and assuming the site (including the soil) is optimal, they may continue to thrive there for decades. Choosing a poor site for the crop of interest or an inappropriate crop for a specific site can be a costly mistake. The WSS is an invaluable tool to ensure these important decisions are made properly to minimize agronomic and economic risk.
How is the Web Soil Survey Different from Soil Test Reports?
Having a WSS report can be complementary in interpreting the soil test reports. The WSS provides additional information on the inherent characteristics of a soil map unit that may not be included in a soil fertility test. Soil test reports provide valuable information on the topsoil pH as well as macro- and micronutrient status. However, this information is transitory and can change from season to season based on cropping patterns and soil amendments. The Web Soil Survey is useful for identifying soil physical conditions such as soil texture, drainage, depth of soil profile, rooting depth, rocks, slope, etc. which are permanent properties. Because soil physical properties are permanent and generally not easy to correct, they must be taken into consideration when deciding on the best sites for locating a vineyard or orchard.

Figure 1. The WSS homepage screen.
How to Use the Web Soil Survey?
Getting Started
- Visit the WSS website (Fig. 1). Basic steps of using WSS are provided on the homepage, but this fact sheet provides more in-depth instructions.
- Click on the round green button that states "START WSS" (Fig. 1).
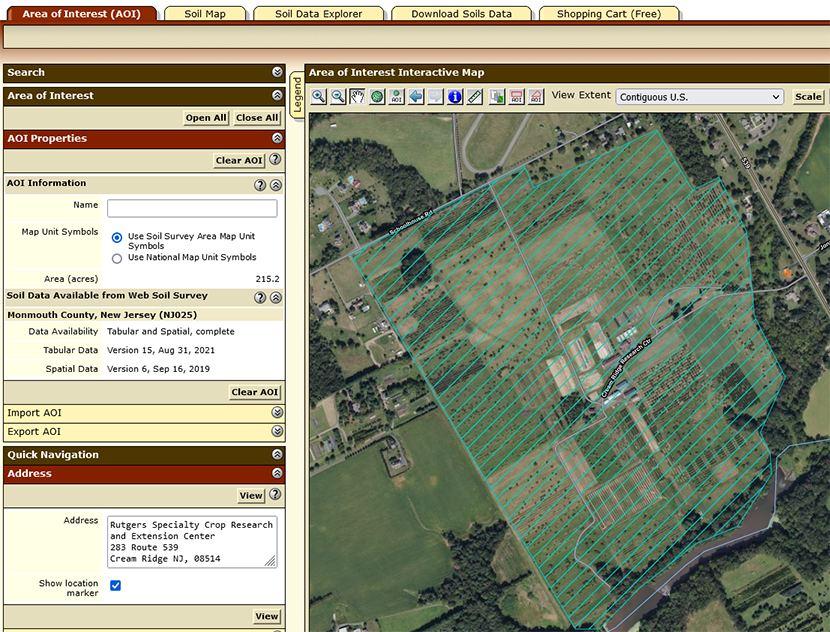
- This will open the "Area of Interest (AOI)" tab and a map of the United States. The area of interest then must be defined in order to access the soils information for a specific area.
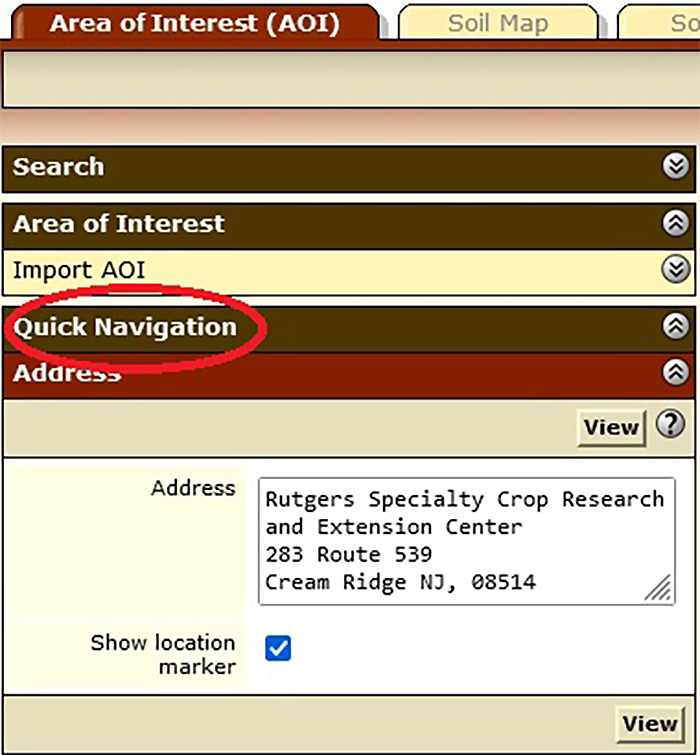
Figure 2. Enter the address to find the location on the map and define your Area of Interest.
Defining an Area of Interest (AOI)
- On the left side of the screen, look for the heading labeled "Quick Navigation." Below is a list of multiple ways to locate a property.
- Click on the heading labeled "Address" and enter the address of the property in the box provided, then click "View" (Fig. 2). If this is a new property without an address, enter a nearby address to access the general location. Additional methods for locating property include latitude and longitute, state and county, or simply zooming in on the map.
-
Click on the "Zoom In" magnifying glass icon to enable the zoom feature, and then click on the location of interest on the map to zoom in until an appropriate resolution is obtained. This can be done similarly by using the scale to zoom in and out.

-
Select one of the AOI icons to define your area of interest (i.e. the perimeter of the field) on the map. The rectangle icon defines an area of interest in the shape of a rectangle, while the polygon icon defines a more irregular property boundary.
 Zoom inOnce the appropriate icon has been selected, draw a rectangle or polygon on the map to define the property boundaries (Fig. 3).
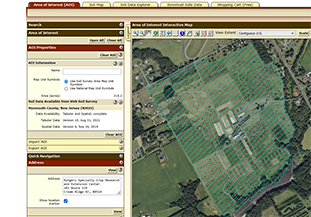
Figure 3. Define your Area of Interest using one of the AOI icons to draw the perimeter of your location.
For the polygon feature, double-click at the last point to complete the outline. - After defining the area of interest, information about the properties of the soil map unit specific to that location are presented.
Learning About Your Soil
Soil Maps
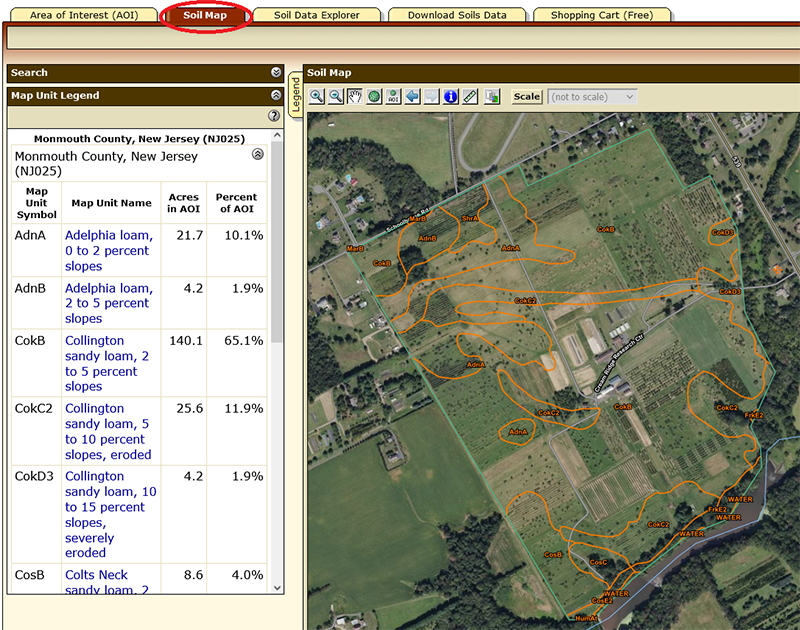
Figure 4. The Soil Map tab displays the different soil map units that exist in an Area of Interest.
- Select the "Soil Map" tab on the top of the screen, next to the AOI tab. This will display approximate boundaries of soil map units, names of soil map units that are present, the number of acres each, and percentage distribution of different soils in that particular AOI.
- In the list of map units at the left of the map, click on the "Map Unit Name" to display additional information about that map unit. However, it is important for users to realize that this data is based on a detailed soil investigation at a reference site remote from their Area of Interest and so can only be considered an approximation or estimate of what's actually there. The description of the map unit also suggests other small areas of similar map units that might be found within the designated map unit.
The detail of each map unit yields valuable information on the composition and texture of the soil (Fig. 5). The map unit also describes other soil properties such as slope, depth to water, drainage, water holding capacity and frequency of flooding, all of which provide valuable information for making decisions on irrigation.Zoom inIt also includes a profile description, that is, the depth increments and texture of soil layers (horizons) expected for that map unit. For example, the top 8 inches of the Adelphia loam described in Figure 5 are typically composed of loam, followed by 23 inches of sandy clay loam, followed by 7 inches of sandy loam, and the deepest layer is 22 inches of loamy sand.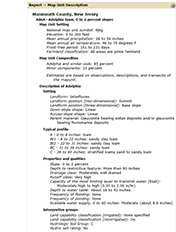
Figure 5. Detailed description of the Adelphia loam (AdnA) soil map unit.
- To access or download a copy of this information, you can click the "Printable Version" tab or "Add to Shopping Cart" tab in the upper right hand of the display which will compile the maps and associated soil types into a free downloadable custom report for your Area of Interest. The Printable Version option will produce a pdf of the current assessment that can be viewed and downloaded (as a pdf) immediately. Use Add to Shopping Cart to assemble several assessments of the Area of Interest; click on this tab for each property or suitability assessment that you examine during the Web Soil Survey session to create a custom soil report for this Area of Interest.
Soil Data Explorer

Select the "Soil Data Explorer" tab to learn more about the soil characteristics of your AOI. When you click on the Soil Data Explorer tab, a secondary set of tabs will appear underneath. Note that soil maps units with similar soil properties are represented by the same color code. Click on the "Legend" tab (at the upper left-hand corner of the map) for interpretation of the color coding.
Soil Properties and Qualities

The "Soil Properties and Qualities" tab will provide additional information regarding the physical, chemical, and soil health properties of the defined Area of Interest, including soil pH. However, it is important to remember that this is the pH level of the native background soil, and that soil pH is a dynamic property readily affected by management inputs, i.e. liming, fertilization, and composting. If the land has been farmed previously, or if lime has been applied to a field, the pH level may have changed. Thus, as noted before, in addition to assessing a piece of property using the WSS, it is important to also obtain a current soil fertility test which includes a pH measurement.
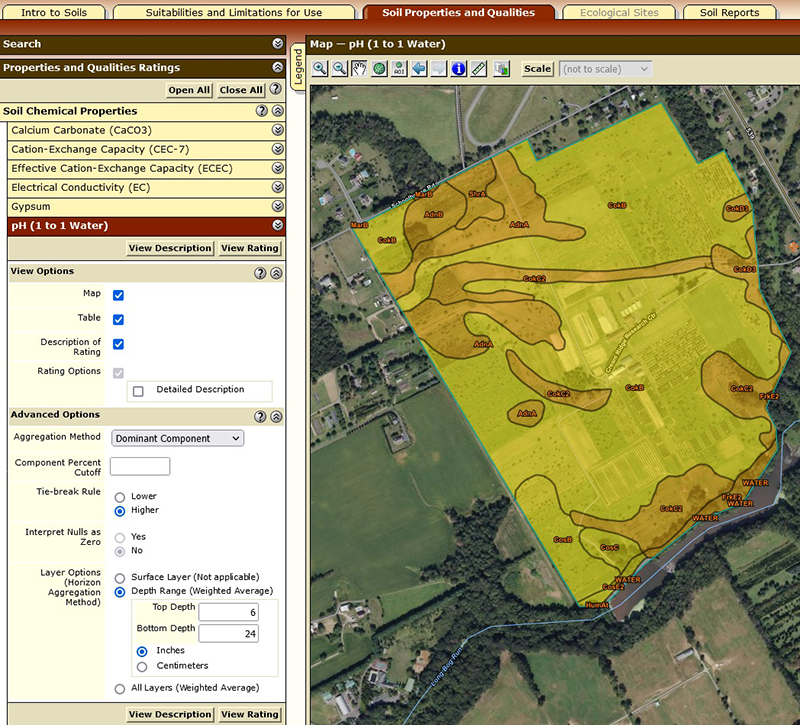
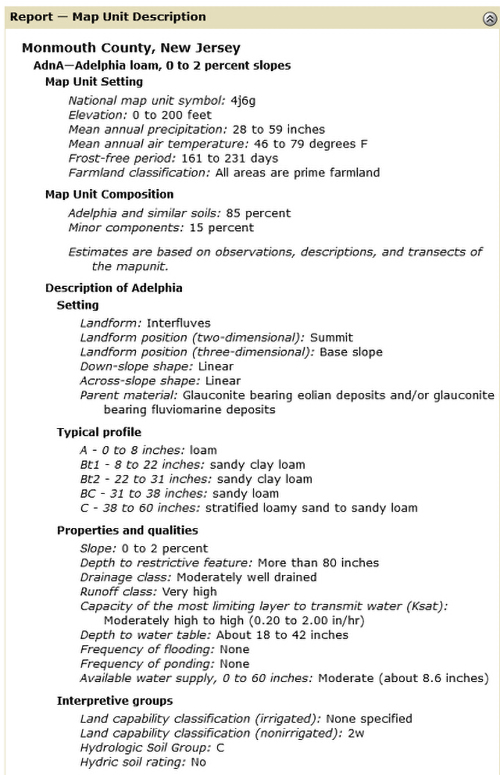
Figure 6. pH distribution of soil map units in the Area of Interest.
Steps to obtain a soil pH distribution map: Click "Soil Data Explorer"; then click the "Soil Properties and Qualities" tab; then click "Soil Chemical Properties" in the menu at the left; then click "pH (1 to 1 water)"; then choose "view options" using map, table and rating; then click "depth range" (top 6 inches and bottom 24 inches), which represents a common rooting depth for many perennial plant species; then click "view rating" (Fig. 6). You can click on "view description" to learn about criteria used to evaluate or classify the mapping units for the selected property.
Figure 7. pH distribution table for the soil series present in the Area of Interest.
Interpretation of soil pH map for soil amendment: An understanding of the inherent pH levels at the 6" to 24" depth increment of the native soil map units that are present will support decision-making on the frequency and amount of liming materials that are required to bring the soil pH into the optimum range for a specific crop. The table below (Fig. 7) highlights details of the map (Fig. 6) that map units AdnA and AdnB typically have an average pH of 4.6 in that depth increment, while CokB has a pH of 5.2. As a result, an effective soil fertility program will require a different liming and nutrient application regime for each of the map units, to achieve similar pH and ultimately soil nutrient uptake levels. In this example, the AdnA and AdnB areas will require more lime additions than the CokB areas to achieve and maintain a pH level that is in the optimum range for most crops.
Suitability and Limitations for Use

In the secondary set of tabs under "Soil Data Explorer", select the "Suitability and Limitations for Use" tab to learn which agricultural activities are best suited to the soil units within the AOI of interest.
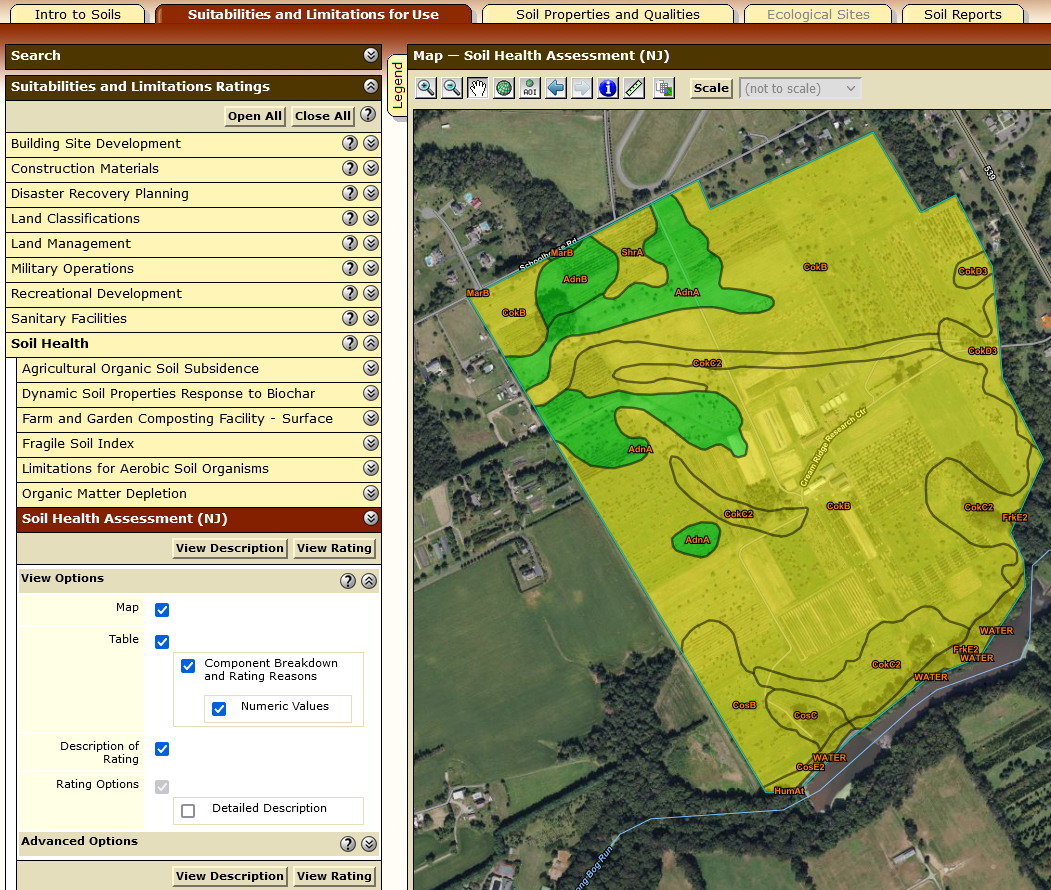
Figure 8. Use the Soil Health Assessment rating for further assessment of the productive capacity of the soil in your AOI.
Soil Health Assessment: In the menu at the left of the map, select "Soil Health Assessment (NJ)"; this rating scheme is specific to New Jersey. The soil health assessment considers both dynamic and inherent soil properties to evaluate the productive capacity of a soil (Fig. 8). These properties include water capacity, salinity, clay content, pH, cation exchange capacity, drainage, erodibility, slope, and soil texture. Click on "View Description" to get further information about the criteria used to assess soil health on a scale of 0.1 (poor) to 1.0 (best). A soil rated as 'good' (> 0.5) has properties that are very conducive to microbial activity, water holding capacity, and nutrient availability. Soils rated as fair (>0.4 through <0.8) require some management to improve properties that will enhance soil health. Poor rated soils (≤0.4) are depleted of nutrients, have minimal biological activity, and require significant management to improve. To view the evaluations of soil health for your AOI (in New Jersey), click on "View Rating". Remember that in addition to the overall assessment exhibited in the map (view the legend to find rating color codes), the table below the map describes the reasons for the assessment for each mapping unit (and minor components within the mapping unit), which can be more useful in determining if/how soil health might be improved.

Figure 9. Farmland classification ratings are distinguished with different colors according to the properties of the soil map units.
Land Classification: There are many crop compatibility recommendations based upon soil classifications within an AOI, all of which can be accessed in the "Soil Data Explorer" tab. These include "Farmland Classification", and "Vegetative Productivity". The Farmland Classification rating will identify map units as prime farmland, farmland of statewide importance, farmland of local importance, or unique farmland. It identifies the location and extent of the soils that are best suited to food, feed, fiber, forage, and oilseed crops (Fig. 9).
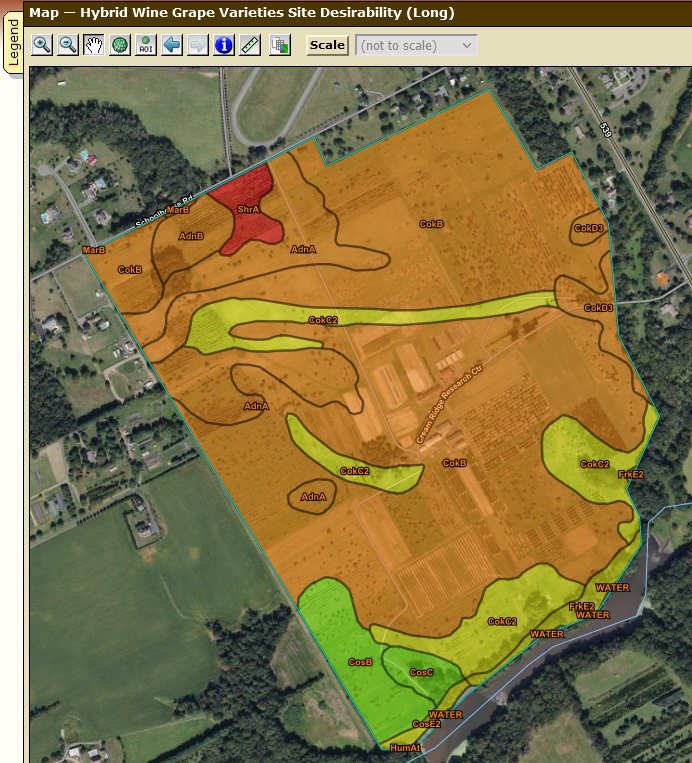
Figure 10. Map displaying site desirability for long season hybrid wine grapes.
Hybrid Wine Grape Varieties Site Desirability: Aside from general farmland classification, there are a number of specific crop suitability indexes, including wine grapes. This index distinguishes which areas of soil are most suitable for growing a number of different grape varieties. Parameters used to develop this index include soil moisture, pH, soil fertility, slope, and climate factors that include growing degree days. Ratings range from 'Very High' (1), indicating vines are particularly well suited to grow on that site, to very low (0.01), indicating vines are not likely to grow or persist on that given site.
Steps for Obtaining the Site Suitability Map for Hybrid Wine Grape Varieties: Click on the "Soil Data Explorer" tab; then click the "Suitabilities and Limitations for Use" tab; on the left menu, click "Vegetative Productivity" and select "hybrid wine grape variety site desirability"; then click "view rating". The output will be displayed in the map (Fig. 10) and table (Fig. 11) format. To understand the reasons for the potential limitations, scroll to view the table and its column, "Rating reasons."

Figure 11. Table displaying site desirability for long season hybrid grapes.
Generating a Custom Report
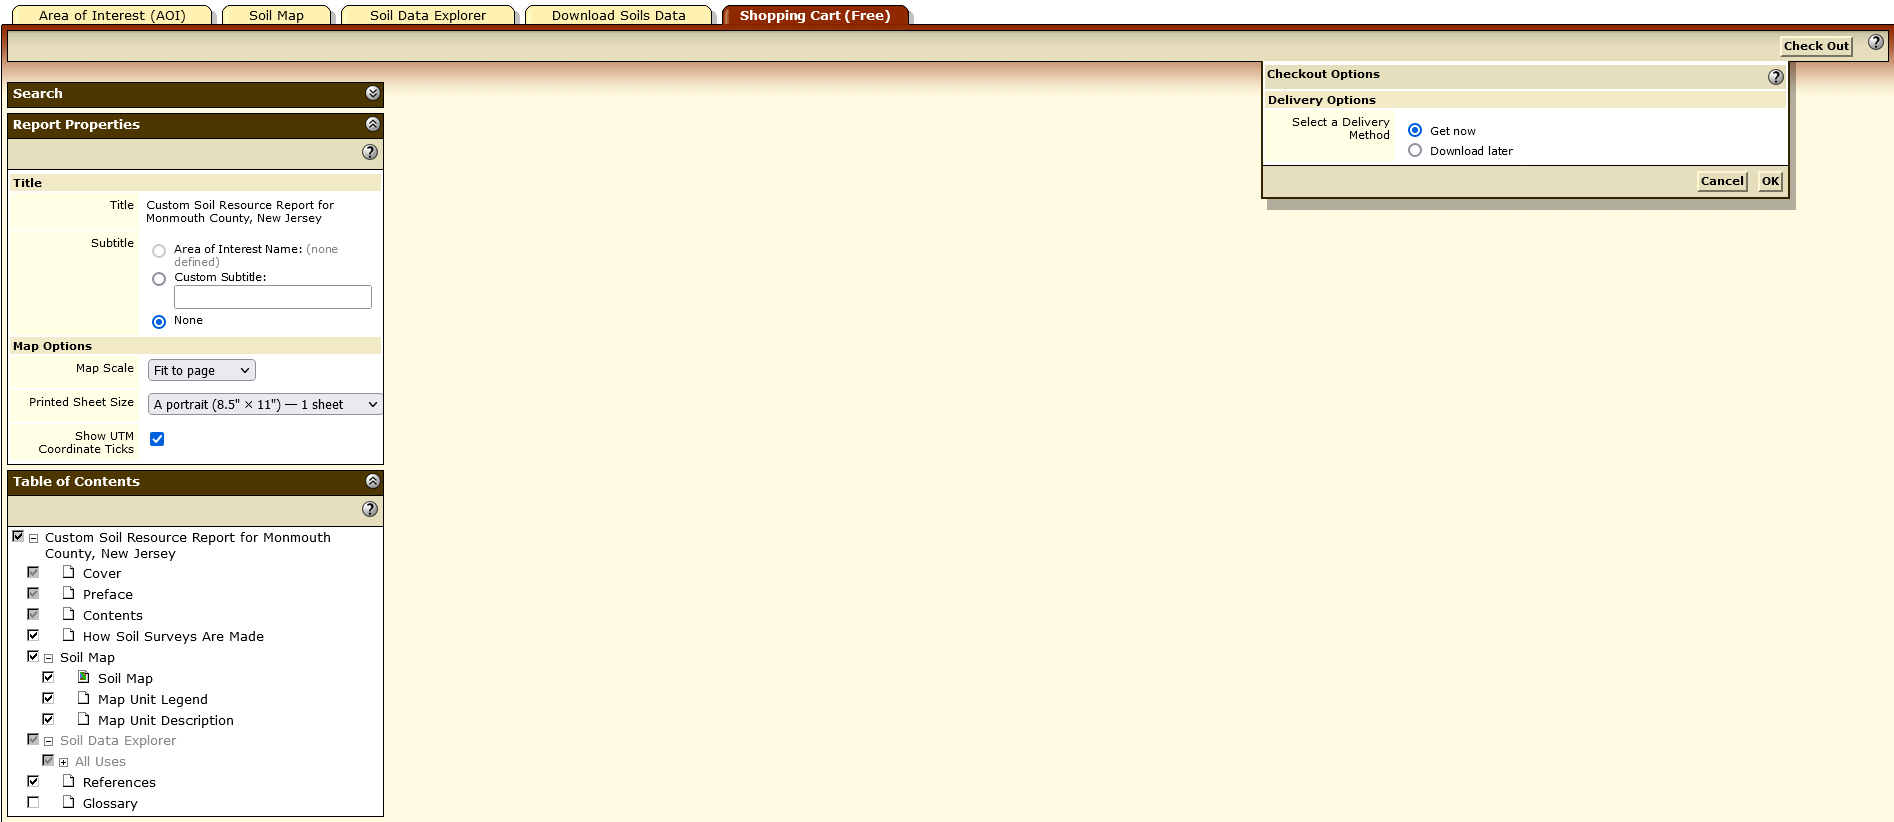
Figure 12. Use the Shopping Cart (Free) tab to generate your custom soil report.
- If you have added any of the soils maps or associated information to the free shopping cart, you can select the "Shopping Cart (Free)" tab to create a custom report for your Area of Interest (Fig. 11).
- Select from several display options on the left-hand side of the screen and check the boxes under "Table of Contents" to choose which maps and information you would like to have appear in the report. The default options include "How Soil Surveys are Made" and "References", which may not be necessary each time you create a custom report; these can be unchecked.
- Click the "Check Out" tab and select "Get Now" to download your report or select "Download Later" (and provide email address) to have the custom report emailed. There is no charge for any of this information or for the report.
- Your custom soil report can be saved to your computer and/or printed out for a physical copy.
August 2022
Copyright © 2025 Rutgers, The State University of New Jersey. All rights reserved.
For more information: njaes.rutgers.edu.
Cooperating Agencies: Rutgers, The State University of New Jersey, U.S. Department of Agriculture, and Boards of County Commissioners. Rutgers Cooperative Extension, a unit of the Rutgers New Jersey Agricultural Experiment Station, is an equal opportunity program provider and employer.